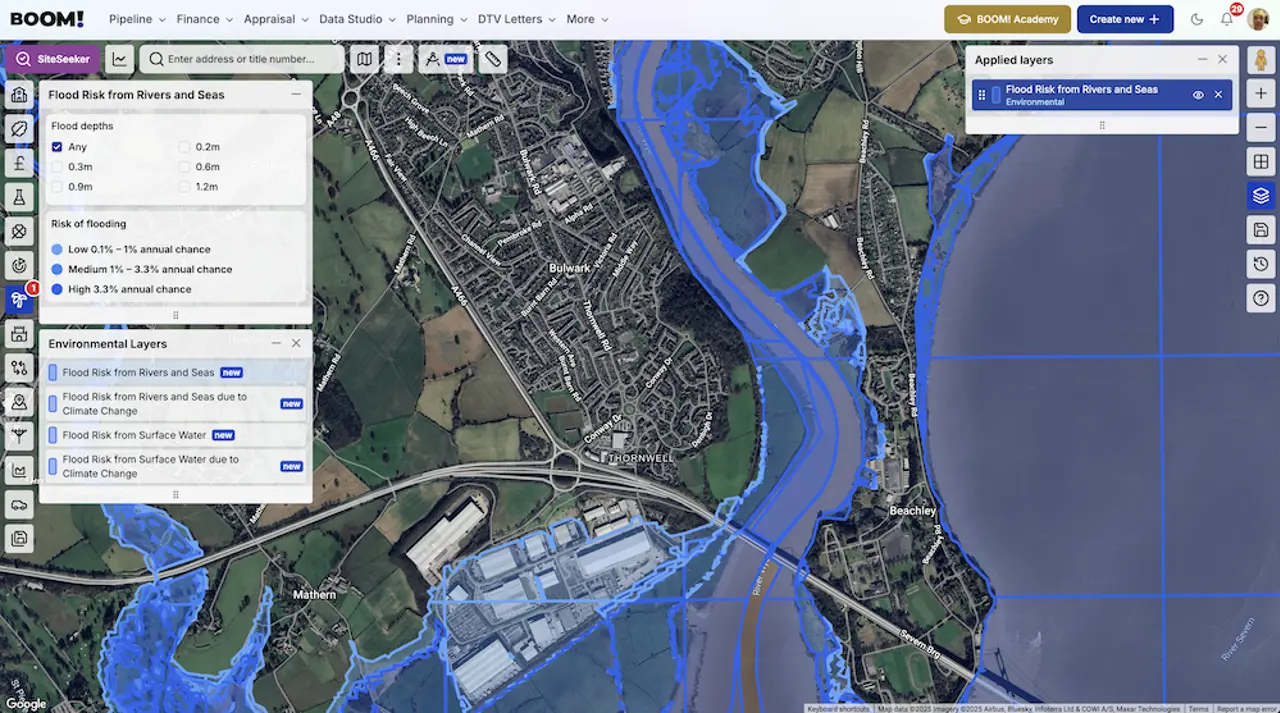
Four flood risk layers are now live in BOOM!. They let you see, on any site, how likely flooding is, how deep it could get, and how both of those change once climate allowances are applied – before you commission anything.
The exposure is not marginal. The Environment Agency’s December 2024 national assessment put 6.3 million properties in England in areas at risk from rivers, the sea or surface water – around 4.6 million of them from surface water alone.
The four new layers are:
- Flood Risk from Rivers and Seas
- Flood Risk from Rivers and Seas (climate change)
- Flood Risk from Surface Water
- Flood Risk from Surface Water (climate change)
How the risk bands work
Each layer sorts land into three likelihood bands, by annual chance of flooding:
- High – 3.3% or greater each year, a 1 in 30 chance.
- Medium – 1% to 3.3%, between 1 in 100 and 1 in 30.
- Low – 0.1% to 1%, between 1 in 1,000 and 1 in 100.
Why depth matters as much as likelihood
On the map, each layer also carries a depth filter, so you can restrict what you are looking at to land that could flood to at least 0.2m, 0.3m, 0.6m, 0.9m or 1.2m.
That second number is what decides the design. A low-likelihood event that reaches 0.6m still means raised floor levels, habitable rooms off the ground floor and a conversation about safe access. A high-likelihood event at 0.2m may be a drainage problem rather than a scheme-defining one.
Likelihood bands are not Flood Zones
Worth being precise about, because planners will be. These layers describe how likely flooding is. Flood Zones describe something different – a probability of river and sea flooding ignoring defences, used as the evidential basis for the sequential test. A site can sit in Flood Zone 3 and show as low risk on a likelihood map because a defence is doing its job.
As of September 2026, the Flood Zones themselves are the ones defined in Annex F of the National Planning Policy Framework published on 17 August 2026, and they are mapped on the Environment Agency’s Flood Map for Planning. BOOM! carries Flood Zone 2 and Flood Zone 3 as separate layers for exactly that reason. The flood zones guide sets out which tests each zone triggers.
Using them on a real search
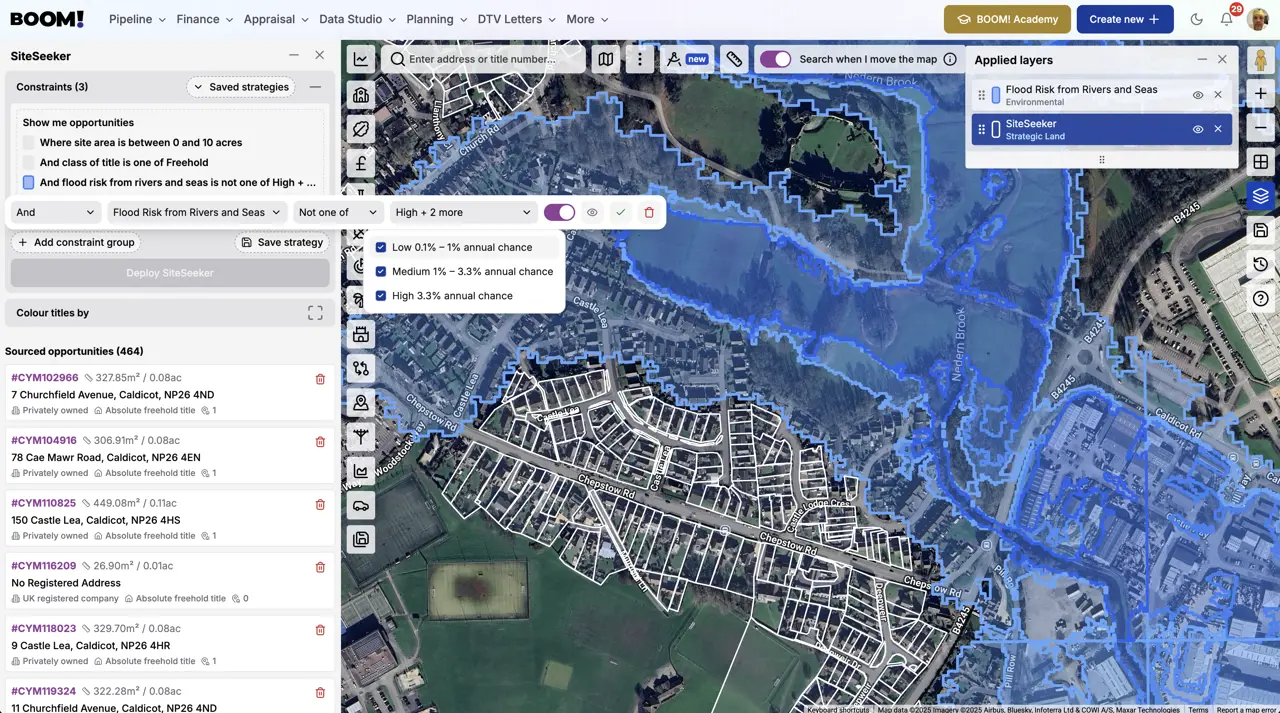
Toggle the layers on in Data Studio to read a single site, including the depth filter. All four are also available as SiteSeeker constraints, filtering on the risk band, so you can exclude high risk land from a search across a whole district rather than checking sites one at a time.
Run the climate change versions alongside the present-day ones. The gap between them is the part of your risk that arrives after you have sold, and it is the part a planning officer will ask about.
For the wider screening process these layers fit into, see how to check flood risk before you spend money on a site.