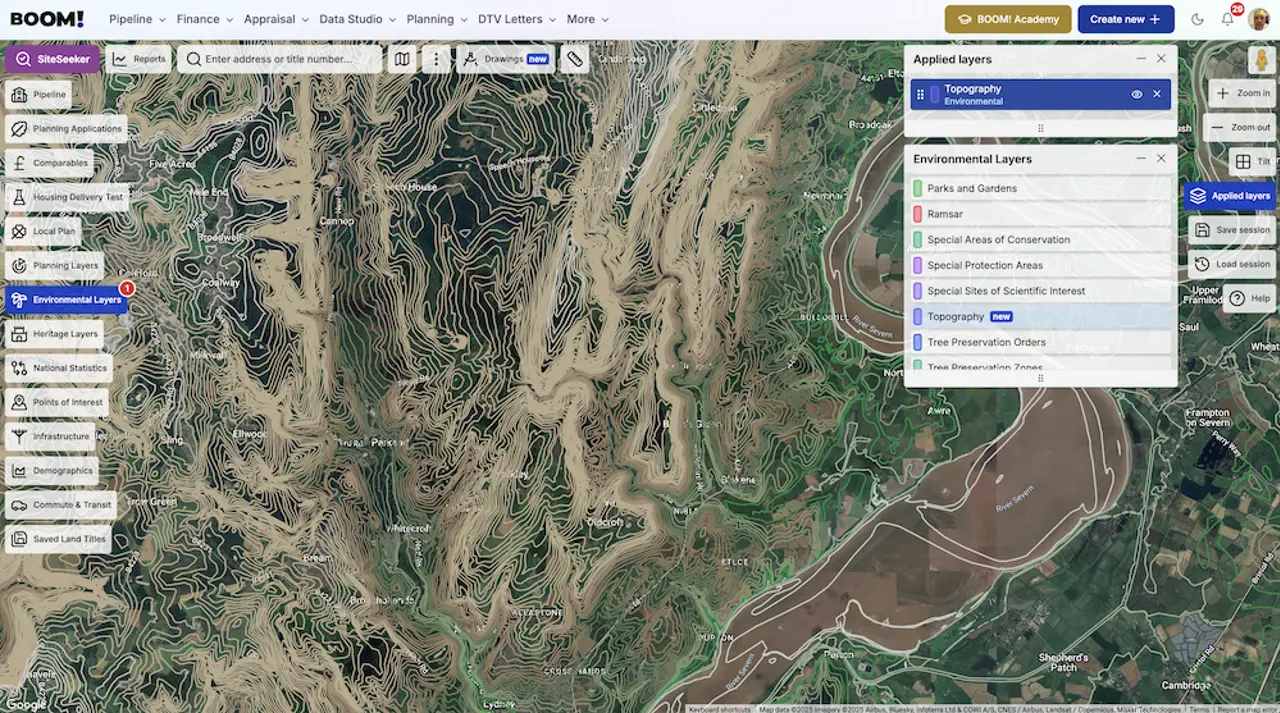
The topography layer is live in BOOM!. It colours the map by height above sea level and reports the height at any point you click, so you can work out which way a site falls, and roughly how far, without leaving your desk.
Levels are the thing you cannot see in a photograph and cannot infer from a title plan. They decide cut and fill, whether you need retaining structures, and – the one that most often kills a scheme – whether surface water can reach an outfall by gravity.
How the colour bands read
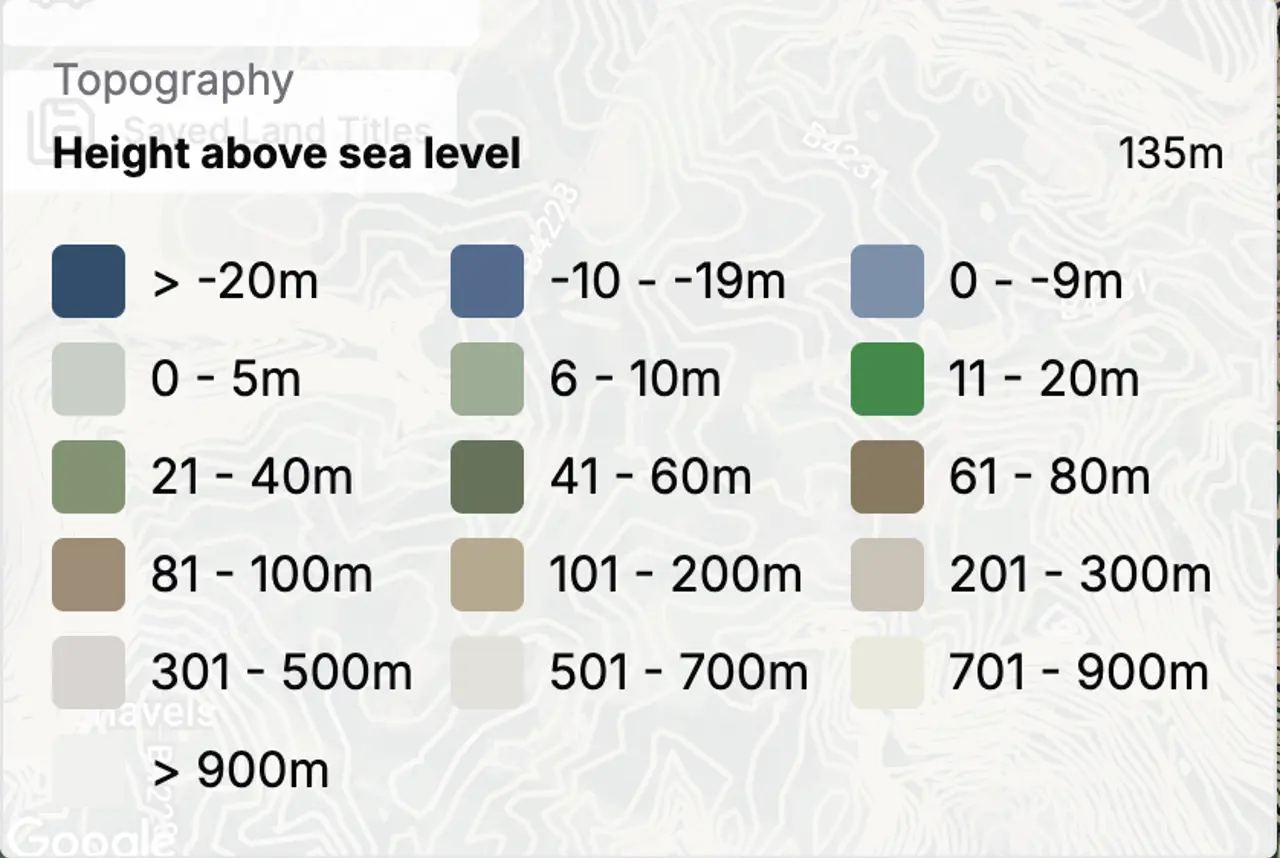
The palette runs from blue below sea level through greens and browns to near-white at the tops. The bands are deliberately tighter at the bottom of the range, where a small change in level matters most to a development, and wider higher up:
- Five-metre bands from sea level to 10m, where most sites sit.
- A 10m band to 20m, then 20m bands up to 100m.
- 100m bands to 300m, and 200m bands above that.
- Separate bands for land below sea level.
Read the spacing rather than the colour. Where several bands change over a short distance on the map, the ground is falling quickly. Where one colour runs across the whole site, it is flat within that band. Click anywhere to get the height at that point, and take two readings across the boundary to work out the fall.
Turning a fall into a decision
Two clicks give you a height difference. Divide it by the distance and you have a gradient, which maps onto a threshold worth knowing: Approved Document M Volume 1 calls a plot “steeply sloping” where the gradient exceeds 1:15, and it is on those plots that a stepped approach to the entrance is accepted instead of step-free access. Under that, you are designing around levels. Over it, the levels are designing the house.
The guide to sloping sites covers what that actually costs, and where the discount on difficult ground turns into margin.
What it is, and what it is not
This is a screening tool. It is built to take a longlist down to a shortlist, not to design against. Once a site is worth pursuing, a measured topographical survey is what the drawings get built on.
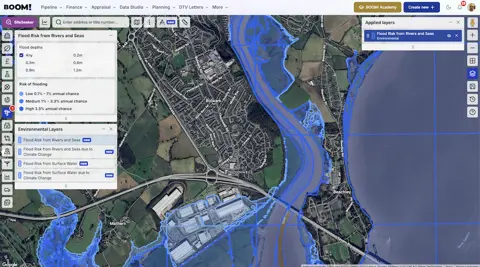
It is also not a flood layer. Elevation correlates with flood risk but does not determine it – surface water floods high ground too. BOOM! carries flood risk from rivers and seas and from surface water as separate layers, each with a climate change version, and Flood Zone 2 and Flood Zone 3 for the planning position. Those are the ones to use for flooding; see the flood risk layers.
Turning it on
Topography sits under environmental layers in Data Studio and is available to Professional members. Zoom in to the site – the layer draws from street level rather than at national zoom – then click any point for the height above sea level and the full legend.
Professional is £20 a month, and there is a seven-day free trial if you want to try it on a live site.