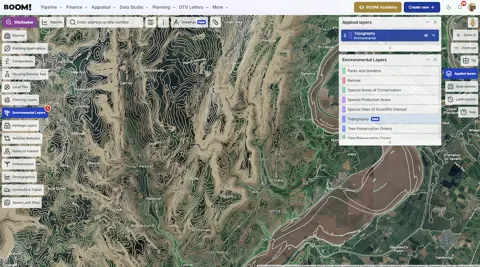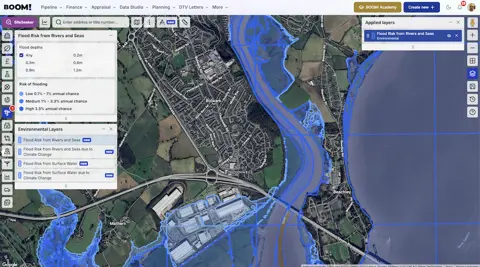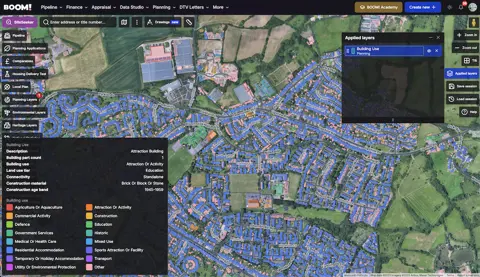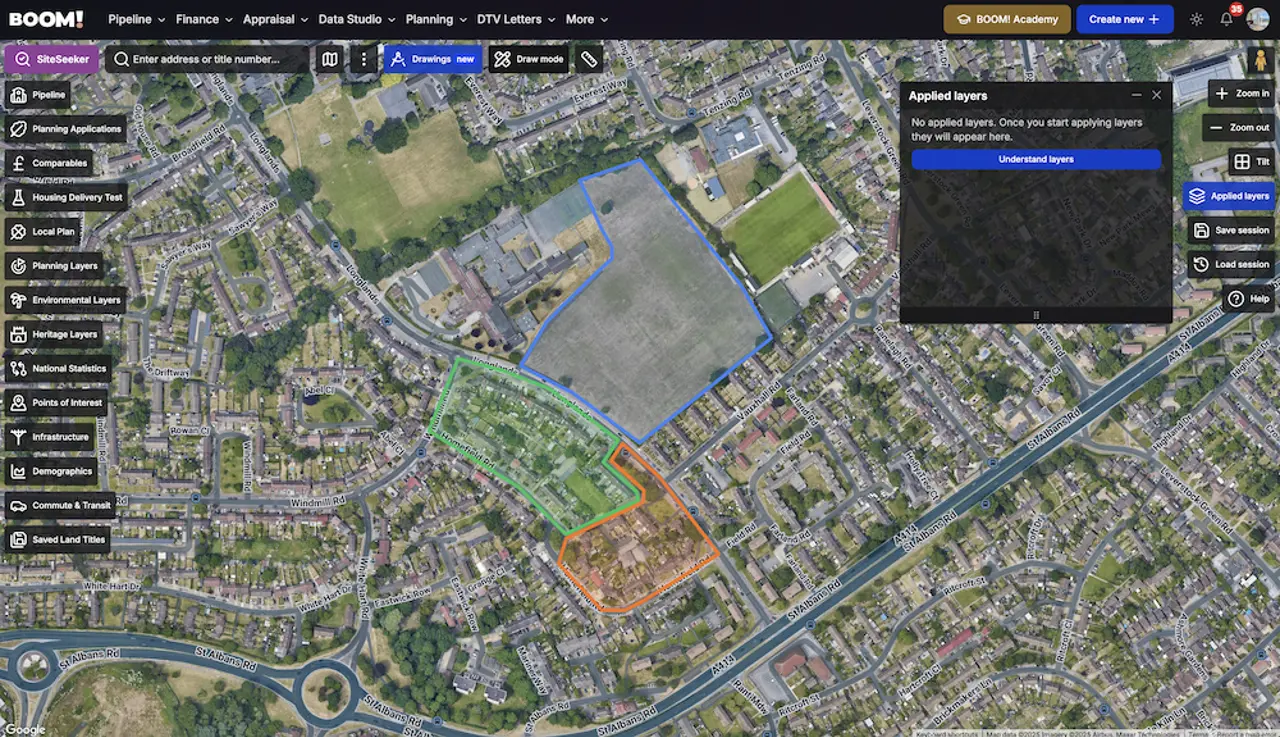
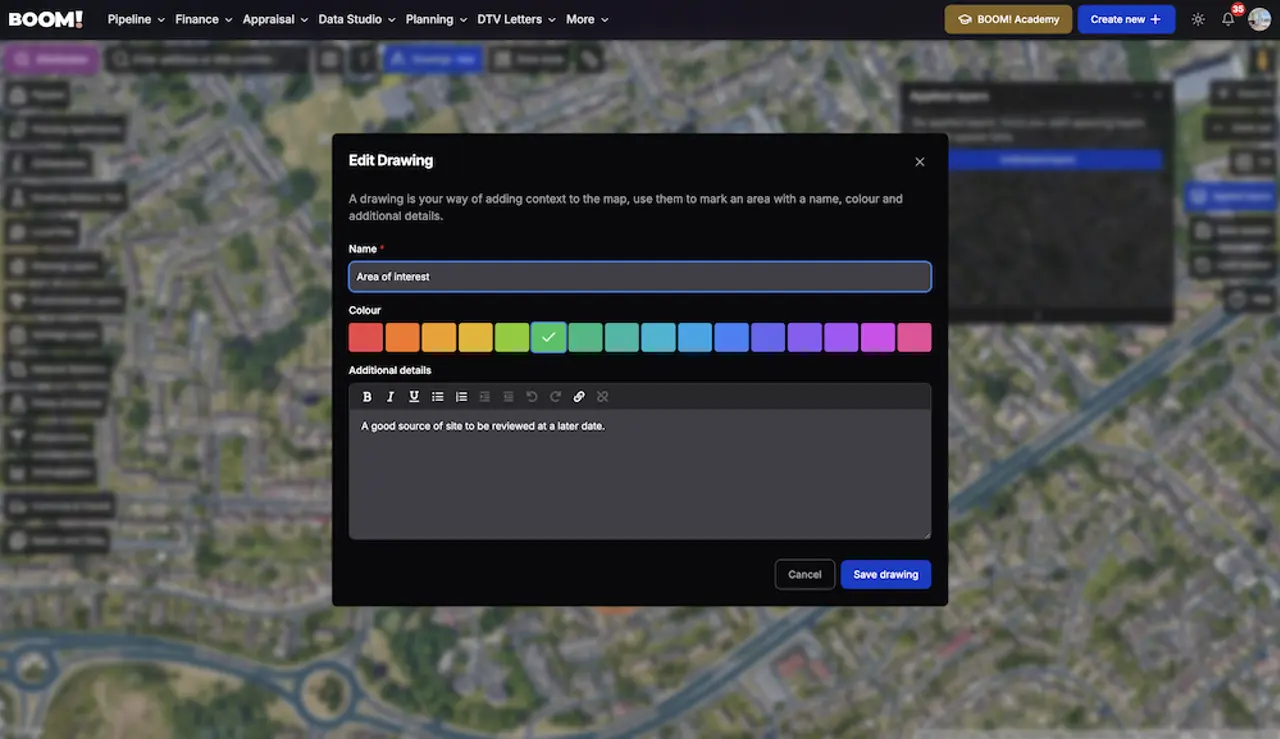
Draw a shape on the map in Data Studio and BOOM! tells you its area in square metres, acres and hectares as you go. Name it, colour it, add notes, and it stays there the next time you open the map.
That removes the step most sourcers do badly: screenshotting a map into another app, drawing on it, and then losing track of which screenshot was which site.
What you can do with Drawings
- Draw a custom polygon anywhere on the map.
- Read the area back in m², acres and hectares while you are still drawing it.
- Give it a name, pick a colour, and write notes against it in a rich text editor.
- Edit the shape or delete it as the plan changes.
When you save, BOOM! also suggests addresses that fall inside the shape, so naming it is usually one click rather than typing out what you just drew.
Save a shape as a custom land title
A drawing does not have to stay a note to yourself. On save you choose what it is:
- Overlay — context on the map. A name, a colour and notes.
- Custom land title — the shape becomes a title you can use in a workflow and in a DTV letter, exactly like a registered one. Useful for the part of a field you actually want, an unregistered parcel, or a land assembly made of several ownerships.
Custom land titles need the Workflows and DTV add-on, and there is a size limit: a shape over 50,000 m² — five hectares, just over 12 acres — cannot be saved as one. Draw the developable part rather than the whole holding.
How sourcers actually use it
- Mark the ground you have already covered. Name a shape “searched, January” and you stop re-reviewing the same village every few weeks.
- Record why a site was ruled out. Notes on the shape beat notes in a spreadsheet you will not open again. Access, levels, a neighbour objection — whatever killed it.
- Test a layout roughly. Draw the developable area, read the acreage, and see whether the unit count you had in mind was ever realistic.
- Outline a target zone. The land just outside a settlement boundary is a common one — see our post on how planners use settlement boundaries for why that edge is worth marking.
Where to start
Open Data Studio on the area you are working, draw round the last site you looked at, and save it with the reason you did or did not pursue it. Do that for a month and you have a record of your own patch that no one else has — which is most of the advantage in off-market sourcing.