The Housing Delivery Test is the one national dataset that tells you, council by council, where the planning balance has moved in a developer’s favour. It is published annually as a single spreadsheet, and a score below 75% changes what a council can refuse.
In the 2025 measurement, published on 17 August 2026, 93 of the 301 scored authorities in England came in below 75%. This post explains what that does and how to use it.
What is the Housing Delivery Test?
The Housing Delivery Test measures net homes delivered in an authority’s area against the homes required over the previous three years, using national statistics and local authority data. The Secretary of State publishes a result for every plan-making authority in England.
The 2025 measurement covers the financial years 2022/23, 2023/24 and 2024/25. It was published alongside the 2024 measurement on 17 August 2026, after a delay caused by the planning reform consultations. A published result stands until the next one replaces it, and the consequences apply from the day after publication.
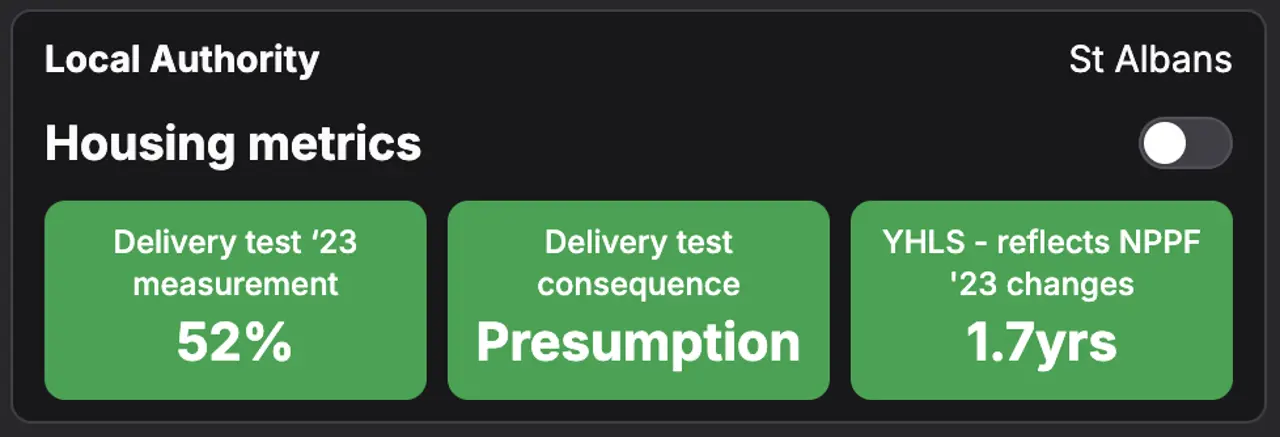
What each threshold triggers
Annex D of the NPPF sets three thresholds, and they stack.
- Below 95% — the authority must prepare an action plan setting out the causes of under-delivery and what it will do about them;
- Below 85% — a 20% buffer is added to its five year housing land supply, on top of the action plan;
- Below 75% — an evidenced unmet need for housing is deemed to exist for the purposes of policy S5(1)(j), on top of the action plan and the buffer.
That last one is the one that matters commercially. Policy S5 governs development outside settlements and permits only a defined list of things. Item (j) is development addressing an evidenced unmet need, provided it is physically well-related to an existing settlement and of a scale the infrastructure can take. A sub-75% score puts your scheme on that list without further argument.
Note what changed in August 2026. This used to be described as triggering the presumption in favour of sustainable development under paragraph 11. The mechanism is now S5(1)(j), and the wording you use in a planning statement should follow it.
The 2025 results, in numbers
Of the 304 authorities listed in the 2025 measurement, 301 carried a score. The consequences fell out:
The spread at the bottom is wider than most people expect. The City of London scored 4%, Castle Point and Portsmouth 11%, Southend-on-Sea 20%. Scores that low are usually a constrained authority with nowhere left inside its boundary — which is precisely the sourcing signal.
How to use a Housing Delivery Test score
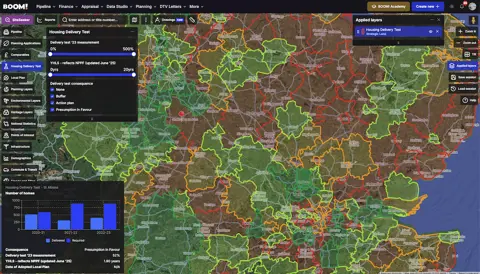
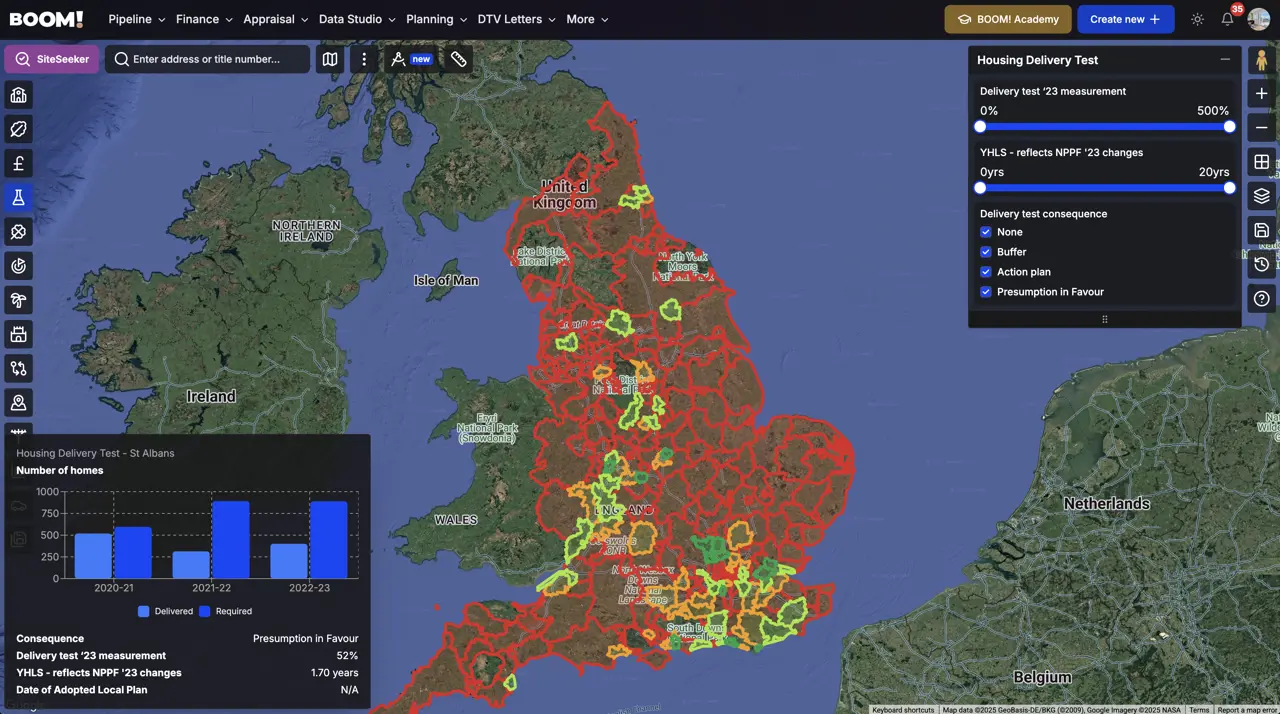
- Filter to the sub-75% authorities first. BOOM! carries the Housing Delivery Test as a map layer, so you can see which districts carry the consequence before you look at a single site.
- Search outside the settlement boundary. Inside the boundary, policy S4 already favours you and the score adds little. The score earns its keep on land that is well-related to the settlement edge but outside the line.
- Check the five year supply position too. The two tests are separate, and a housing land supply shortfall reaches the same policy route. A district failing both is the strongest position there is.
- Cite it precisely. Name the measurement year, the score and the consequence, and quote policy S5(1)(j) rather than the old tilted balance language.
A sub-75% score is also one of the two ways to evidence unmet need for grey belt development under policy GB7, which is what makes Green Belt districts with poor delivery worth a second look.
What the score does not do
It does not make a site acceptable. Flood risk, heritage, protected landscapes, highways and the rest still apply, and policy S5 says the benefits can be substantially outweighed by adverse effects. A sub-75% score gets you into the category of development that should be approved; it does not carry a bad site through.
It also expires. Results supersede one another on publication, so a case built on a 2025 score needs rechecking the day the next measurement lands.