A five year housing land supply shortfall is the single cheapest signal in site sourcing. Where a council cannot demonstrate one, national policy treats unmet housing need as evidenced — and that unlocks a route to permission outside the settlement boundary that does not otherwise exist.
This post covers what the rule requires, what a shortfall actually does under the National Planning Policy Framework published on 17 August 2026, and how to turn a council’s own published number into a search area.
What is a five year housing land supply?
Annex D of the NPPF requires every local planning authority in England to identify, and update annually, a supply of specific deliverable sites sufficient for a minimum of five years’ worth of housing. That is measured against the housing requirement in the development plan — or, where the plan’s housing requirement is more than five years old, against local housing need calculated using the standard method.
On top of the five years, the supply has to carry a buffer:
- 5% as standard, to ensure choice and competition in the land market;
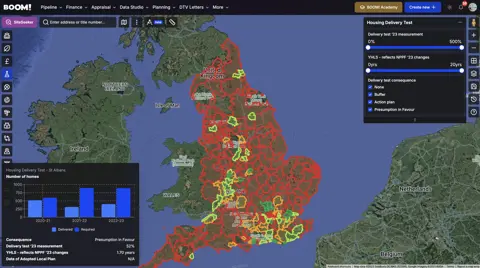
- 20% where there has been significant under-delivery over the previous three years, which is measured by the Housing Delivery Test falling below 85%;
- 20% for decision-making, where an authority’s housing requirement was adopted in the last five years against a pre-December 2024 version of the framework and its annual average requirement is 80% or less of the current standard method figure.
That third buffer is new and it is the one to check first. It catches councils with a recent, adopted plan that was examined against a lower housing number, and it can move an authority from a comfortable 5.4 years to a shortfall without a single site dropping out of the trajectory.
How the standard method figure is built
The standard method sets a minimum annual local housing need figure in two steps. The baseline is 0.8% of the authority’s existing dwelling stock. That baseline is then adjusted for affordability: no adjustment where the five-year average median workplace-based affordability ratio is five or below, and a 0.95% uplift to the baseline for each 1% the ratio sits above five. An authority with a ratio of 10 carries a 95% uplift.
You do not need to recalculate it. You need to know that it is stock-based and affordability-driven, so the highest requirements land on expensive districts with a lot of existing housing — exactly the districts with the least room inside their settlement boundaries.
What a shortfall actually does
This is where most published advice is now out of date. The August 2026 framework replaced the old paragraph 11 “tilted balance” with a presumption expressed through policies S3 to S6, and it turns on whether a site sits inside or outside a settlement.
- Inside a settlement, policy S4 already says development should be approved unless the benefits are substantially outweighed by adverse effects. You do not need a supply shortfall to get there.
- Outside a settlement, policy S5 permits only a defined list of development. Item (j) on that list is development addressing an evidenced unmet need — including, expressly, where the authority cannot demonstrate a five year supply of deliverable housing sites or scores below 75% in the most recent Housing Delivery Test — provided the scheme is physically well-related to an existing settlement and of a scale the infrastructure can take.
So the shortfall does not tilt a balance any more. It opens a gate. Without it, a greenfield site outside the boundary has to find another item on the S5 list; with it, the scheme is in the category of development that should be approved unless the adverse effects substantially outweigh the benefits.
The same shortfall is one of the two ways to evidence unmet need for grey belt development under policy GB7, which is why the two rules are worth tracking together.
The five-year protection that closes the gate
Annex A adds a carve-out worth reading before you build a case. Where an authority can demonstrate a five year supply with the appropriate buffer and its Housing Delivery Test result is above 75%, the fact that the current standard method figure exceeds the adopted housing requirement is not, by itself, evidence of unmet need — for five years from the date the plan was adopted.
In plain terms: “their local plan number is lower than the government’s number” is not an argument on its own in a district with a recently adopted plan that is delivering.
How to source against a supply shortfall
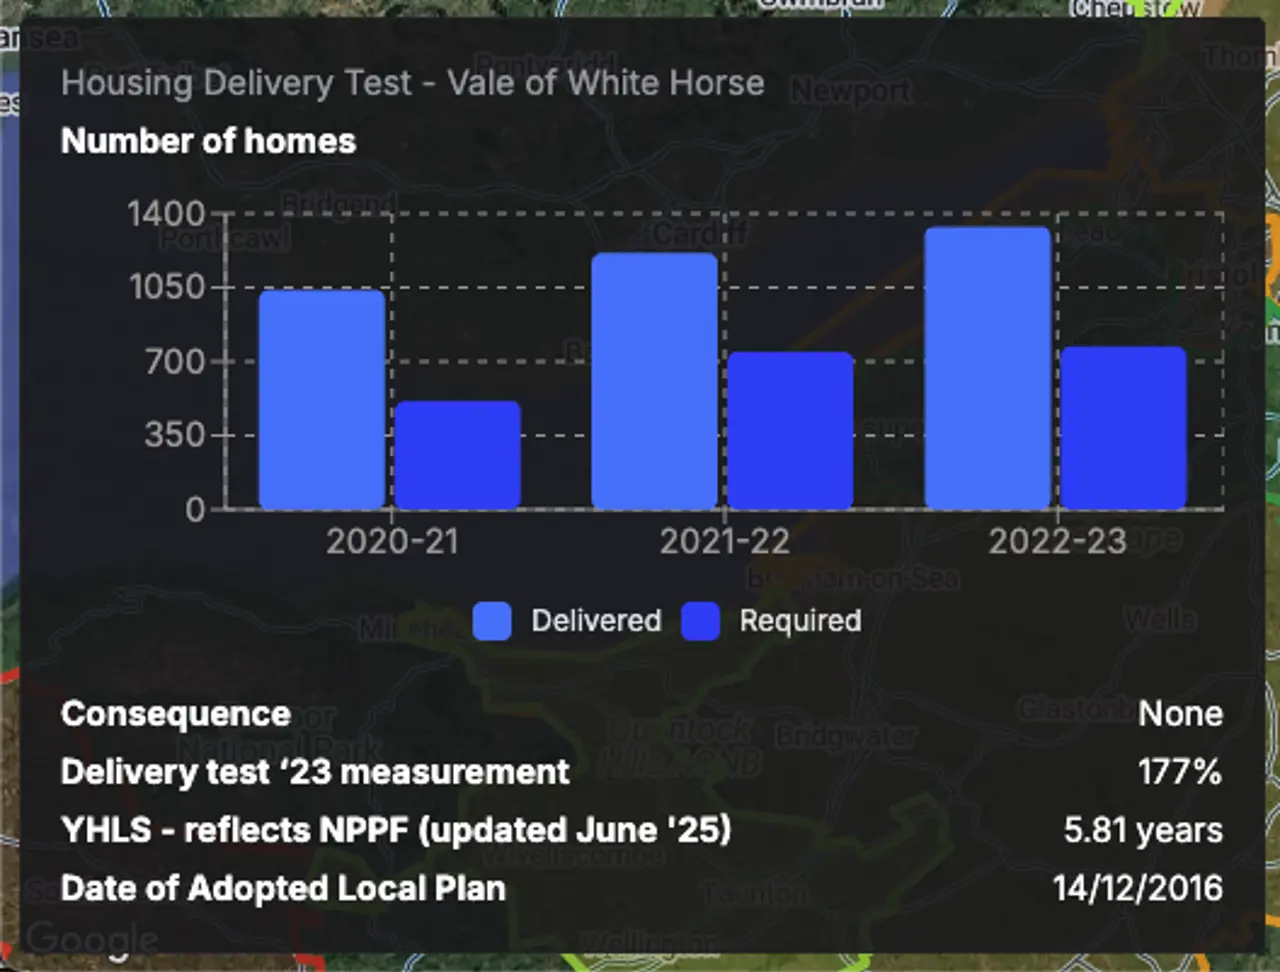
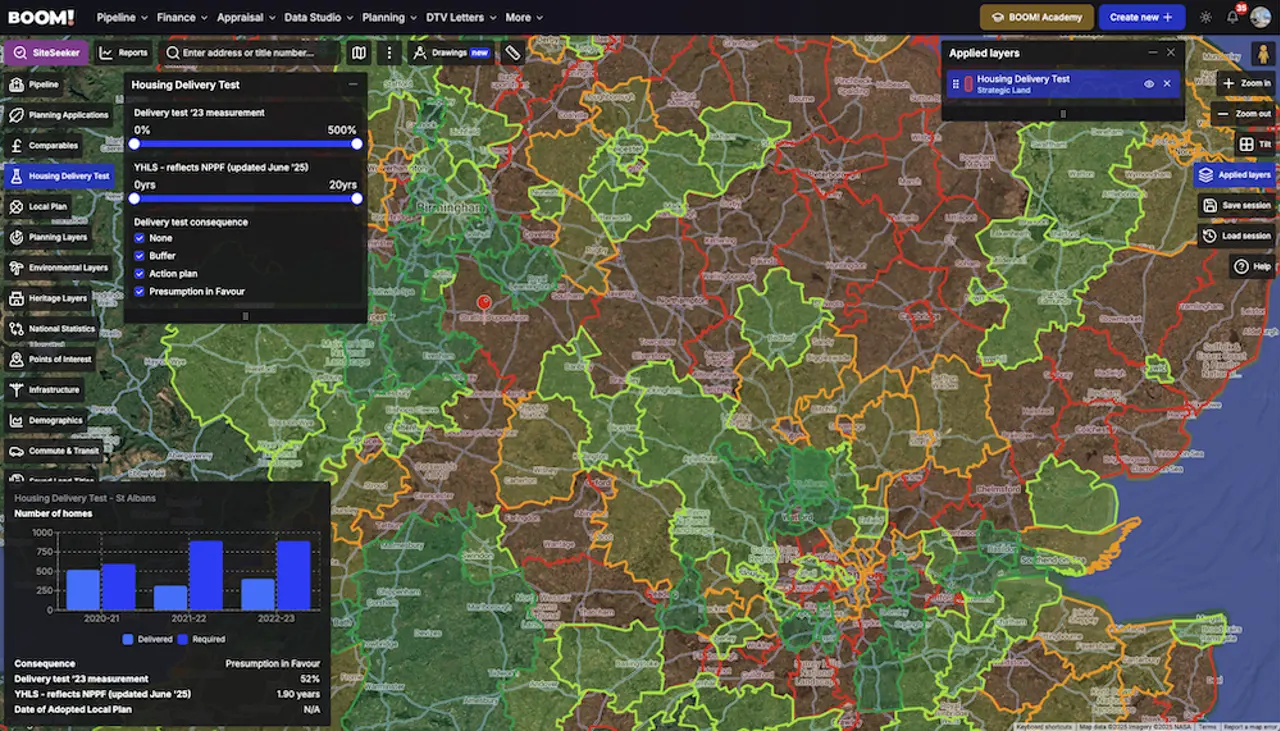
- Find the districts with a shortfall. There is no national register of five year supply positions — each authority publishes its own, usually as an annual position statement or inside the authority monitoring report. BOOM! carries a years of housing land supply layer so you can see the picture across authorities rather than opening thirty PDFs.
- Read the number properly. Check the base date, which buffer has been applied, and whether the requirement is the plan figure or the standard method figure. A 4.6 year position published against a stale requirement is weaker than a 4.6 year position against the standard method.
- Check the appeal record. Recent appeals in the district will tell you whether inspectors have accepted the council’s supply figure or cut it. An inspector’s finding is worth more than the council’s own statement.
- Search the right land. With a shortfall in play you are looking for land outside the settlement boundary but physically well-related to it, with an access point and infrastructure capacity. That is the edge of settlement search, and the shortfall is what makes it viable.
- Write the shortfall into the application. State the authority’s published supply position and base date, identify the policy route — S5(1)(j) — and show how the site is physically well-related to the settlement. Vague references to “the tilted balance” now cite a framework that no longer exists.
Watch the Housing Delivery Test alongside it
Supply and delivery are separate tests with one shared consequence. A council can have a five year supply on paper and still be failing to build. Where its Housing Delivery Test result is below 75%, unmet need is deemed to exist for policy S5(1)(j) regardless of the supply position — and the Housing Delivery Test is published nationally, annually, as a single spreadsheet. It is the easier of the two to work with.